
TechRadar
I used Gemini in Google Sheets to create a weekly budget that updates itself — here’s how
Ever since Google rolled out its suite of AI tools for the company’s Workspace apps in January 2025, Gemini (its proprietary AI assistant) has become a productivity hack on Google apps like Sheets, Docs, Meet, and others.
Gemini in Google Sheets has made data analysis easier, especially for non-tech-savvy users. It can create tables, run and fix formulas, and generate charts and graphs using very simple prompts – no need to grapple with complex functions or spreadsheet jargon. Gemini can respond to plain English and transform even somewhat lazy instructions to accurate, actionable tables.
In this article, we’ll explain step-by-step how you can make a weekly budget plan in Google Sheets with the help of Gemini. Read till the end because we’ll go beyond basic data entry and also explore how to turn a blank spreadsheet into a self-updating financial tracker.
Gemini plans and pricing
While Gemini’s free version delivers excellent value, you’ll need a paid subscription to unlock its full potential. If you’re a business, you can purchase a Google Workspace plan to get Gemini assistance in Sheets, Docs, and more. However, the entry-level plan, at $7/user/month, only offers Gemini in Gmail. To use the AI chatbot in Sheets, you’ll need at least the Standard plan, at $14/user/month.
If you’re an individual user, you’ll need one of Google’s One AI Premium subscriptions, which start at $1.99/month. There’s also a 1-month free trial on all plans, so you can explore Gemini’s capabilities without parting with your money upfront.
How to build a self-updating budget tracker in Google Sheets with Gemini
We’ll use two tables to build a comprehensive weekly budget tracker: a main tracker table and a data feeder table. The first of these will be your primary budget tracking table, which will pull data from the data feeder table.
Click the Gemini icon in the top-right corner of your Sheet to open the Gemini side panel. This is where you’ll enter all the prompts and refine your tables.
Sign up to the TechRadar Pro newsletter to get all the top news, opinion, features and guidance your business needs to succeed!
Main tracker table
Prompt 1: “I want to create a budget tracker. Create a table with four columns: Category, Budgeted Amount, Actual Amount, and Difference.”
Gemini will produce a sample table for you. Press Insert to add the table to your sheet. You can name the table “Main Tracker.”
Let’s briefly understand the four columns we’ve just inserted:
Category: This column classifies all your weekly expenses into categories such as rent, utilities, transportation, and so on. You can add or remove categories based on your spending habits.
Budgeted amount: Here, you’ll enter the amount you’ve budgeted for each expense. Remember, you have to manually update this column at the start of every week, depending on how much you plan to spend.
Actual amount: This shows the actual amount of money you’ve spent for each expense category during the week. The values here will be fetched from the data feeder table, where you’ll log every single expense.
Difference: This column captures the difference between the budgeted amount and the actual amount you’ve spent. A positive value here means you’ve spent less than the budgeted amount (congratulations!), while a negative value means you’ve overspent for that category.
You’ll notice that Gemini doesn’t apply any formulas by default, which is why the Difference column contains static values. This simply means it doesn’t subtract the actual expense amount from the budgeted amount in real time. Luckily, fixing this is incredibly simple:
Prompt 2: “Create a formula for column D that subtracts Actual Amount (C) from Budgeted Amount (B).”
Gemini will now insert the required formula in column D. Any changes in either the budgeted amount or the actual amount will be reflected in real time.
Next, we’ll add a visual cue using conditional formatting, so you can quickly see which expense categories are over budget and where you’ve saved money.
Prompt 3: “Apply conditional formatting to the ‘Difference’ column: red if I'm over budget (negative) and green if I'm under (positive).”
Prompt 4: “Add a Total row at the end of the table, using the SUM formula, totaling the data in column B, C, and D.”
Adding a Total row gives you a quick snapshot of your total weekly budget, total spending, and your overall savings or overspending. Quick tip: apply formatting to highlight this row. In this example, we’ve made it yellow, so we don’t have to go looking for it every time we want an update on our budget.
Data feeder table
It’s time to insert the data feeder table, which will supply the actual expense data to our main tracker table.
Prompt 1: “Create another table with four columns: Date, Expense Category, Description, and Actual Amount. The data in the 'Expense Category' column should be from the category column in the ‘Main Tracker’ table only.”
This is the table where you’ll log all your expenses for the week, along with the date, category, and description. Every time you buy groceries, refuel your car, dine out, or take your friends bowling, this is the table you’ll update.
To make data entry easier, we’ll add a drop-down list to the Expense Category column. This will ensure you don’t accidentally misspell an expense or enter one that doesn’t exist in the main table.
Prompt 2: “The ‘Expense Category’ column in the data feeder table should be a drop-down in each cell, containing options from the main tracker table.”
Now there’s no need to type the category every time – just choose the appropriate expense type from the drop-down list.
Next, we’ll connect the two tables so the actual expenses you enter in the data feeder table are automatically reflected in the main tracker table.
Prompt 3: “Populate the 'Actual Amount' column in the main tracker table by adding a formula that automatically pulls the total expense for each category from the data feeder table.”
This prompt adds a SUMIF formula to the ‘Actual Amount’ column in the main tracker. It looks for each expense category in the data feeder table and calculates the total amount spent under that category. Any change you make in the feeder table will now update the main tracker automatically.
At this point, our budget tracker is almost ready. However, there’s one final issue: When you add more expense rows to the data feeder table, the values in the main tracker may not update. This is because the SUMIF formula Gemini applies in Column C of the main table is static.
Here’s how to fix it:
Prompt 4: “The SUMIF formula used in column C of the main tracker table is static. If I add more entries in the data feeder table, I want it to auto-update.”
That’s it. Your budget tracker is now complete. You can continue adding expenses to the data feeder table, and the main tracker will automatically update. It’ll show your savings (or overspending) in real time.
Analysing your weekly spending
Now that your budget tracker is up and running, let’s learn how to use Gemini in Sheets to draw useful insights that can help you improve your spending habits.
Click on any part of the table and hit the ‘Analyse this data’ option that pops up on the screen.
This will open the Gemini side panel on the right, which generates a list of key takeaways and insights into your weekly budget performance. The AI assistant then analyses all your expenses – and it can also render a visual chart showing the amount spent in each category.
In addition to basic data analysis, Gemini can also perform predictive analysis. For instance, you can ask questions like, “Based on the current trend, what would be my total spending on groceries by the end of the month?” When you have data spanning more than a week (say 3-4 weeks), Gemini can even help identify long-term trends and assist in building monthly savings goals. Try asking: “Identify which category has the highest growth trend in the last four weeks and suggest a realistic monthly savings goal.”
Gemini can dish out insights that aren’t really obvious at first glance, such as an increase in grocery spending on Fridays or a 20% surge in dining costs over the past week. This kind of trend spotting helps you identify and address problem areas quickly.
You can also insert a pie chart for the main tracker. This will add a much-needed visual element to your tracker and help you graphically break down your weekly spending and see what percentage of your total actual expenses is contributed by each category.
Prompt: “Create a pie chart of the main tracker table that updates automatically when any changes are made. Don't include the total row.”
How Gemini simplifies Google Sheets
Building a financial budget tracker on Sheets might sound like wizardry, but thanks to Gemini, it no longer requires struggling with complex formulas or manual data entry. Instead, you can enter simple prompts in the Gemini side panel and build your weekly budget in a matter of minutes.
Feel free to play around with the number of columns, rows, formulas, conditional formatting, and even cross-table links, all using conversational, everyday-level English. This means you don’t have to ransack the Sheets toolbar every time you want to make a change.
After building the tables, Gemini turns into your personal data analyst, helping you draw valuable budgeting insights and identify trends across weeks or months. This makes it easier to spot expense categories where you’re overspending and build a realistic savings plan.
In a nutshell, Gemini eliminates the technical hurdles in Google Sheets, automates a time-consuming process, and makes it less daunting to take better control of your finances.
Krishi covers buying guides and how-to's related to software, online tools, and tech products here at TechRadar. Over at Tom's Guide, he writes exclusively on VPN services. You can also find his work on Techopedia and The Tech Report. As a tech fanatic, Krishi also loves writing about the latest happenings in the world of cybersecurity, AI, and software.
View original source — TechRadar ↗
More from Technology

South China Morning Post
TechnologyJun 5, 2026 · 1 min
AI hyperscaler effect vaults China’s Zhongji Innolight to top of CSI 300 benchmark
South China Morning Post

Indian Express
TechnologyJun 5, 2026 · 1 min
‘Biggest’ farm loan waiver, but also ‘shrinking’ of beneficiary list: Why Oppn is questioning Fadnavis govt
Indian Express
Indian Express
TechnologyJun 5, 2026 · 1 min
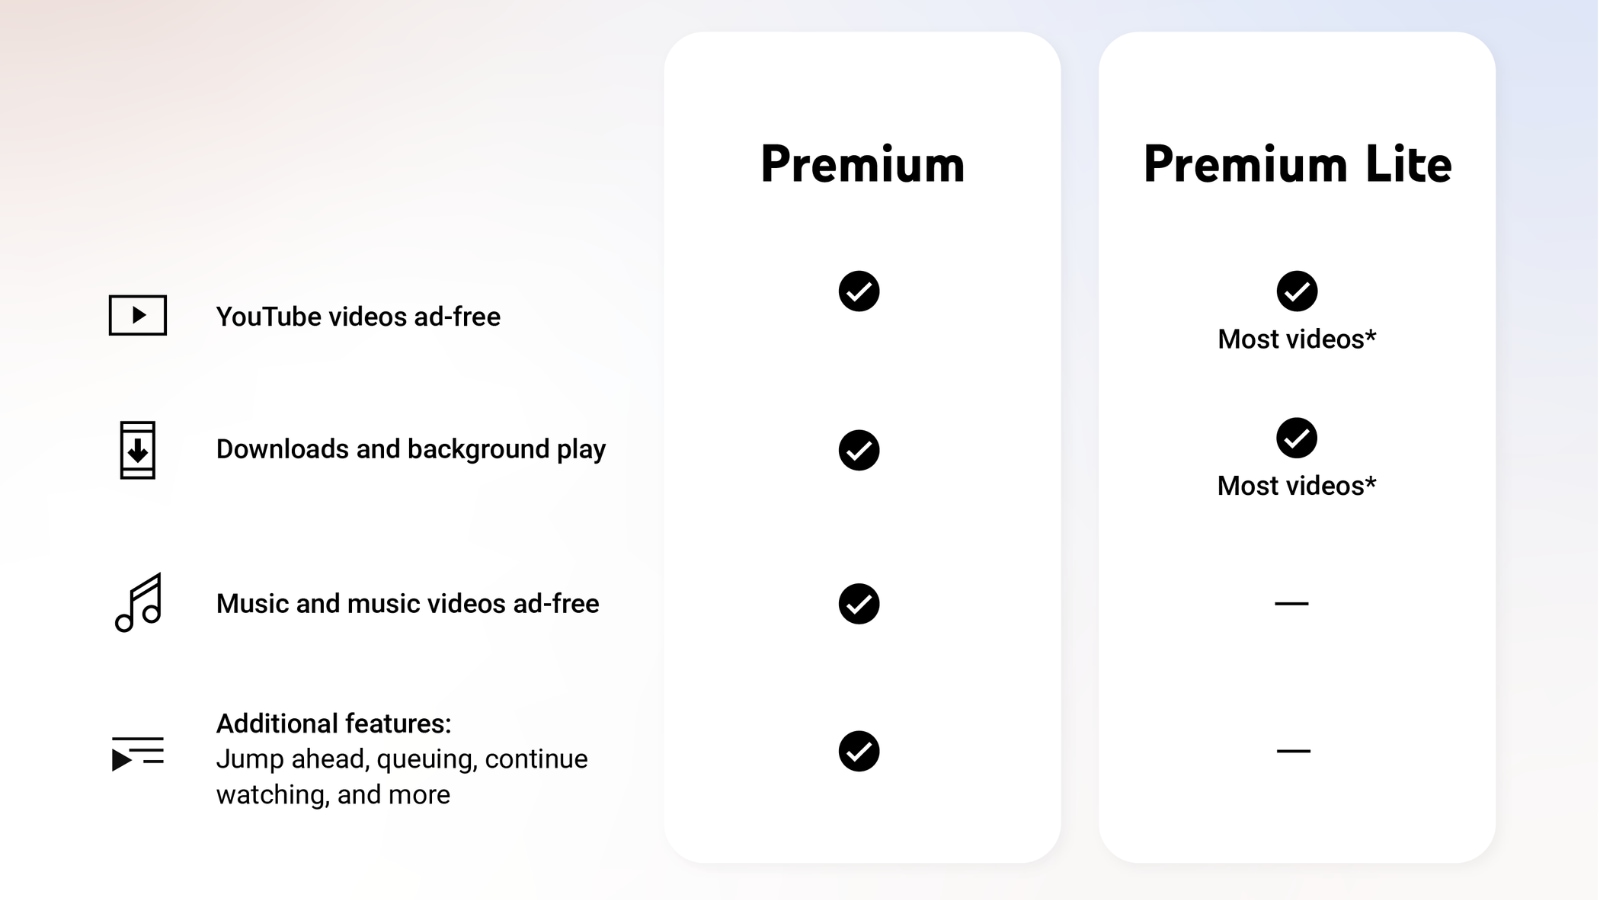
YouTube Premium vs Premium Lite: A look at what each plan offers
Indian Express