
Rio Times
Brazil Fund Flows Swing Positive as High Rates Favor Fixed Income
MARKETS · INVESTMENT FUNDS
Key Facts
—The Brazilian fund industry drew net inflows of R$10.3bn ($1.98bn) in May, according to the markets association Anbima.
—The result reversed an outflow of about R$5bn ($960m) in April; year-to-date net inflows now total R$188.2bn ($36.2bn).
—Fixed income drove the turn, taking in about R$10.4bn ($2bn), led by sovereign low-duration funds at R$22.9bn ($4.4bn).
—Equity funds saw outflows of R$149m ($29m) in May, deepening the year’s redemptions to R$5.6bn ($1.08bn); pension funds lost R$2bn ($385m).
—Index funds, or ETFs, took the second-largest inflow of the month at R$3.5bn ($673m).
—The industry’s total assets stand at roughly R$11 trillion ($2.12tn).
Brazil fund flows turned positive again in May, with net inflows of R$10.3bn ($1.98bn) reversing the previous month’s withdrawals, as the country’s high interest rates pulled savers firmly toward fixed income and away from the stock market.
What the May Brazil fund flows show
The figures come from Anbima, the association that represents Brazil’s financial and capital markets and tracks the industry month by month. They show the sector drawing in more money than it gave back in May, a clear swing from April, when withdrawals had outpaced deposits.
For the year so far, the picture remains comfortably positive. Net inflows since January add up to a substantial sum, and the industry now oversees assets worth around eleven trillion reais, a scale that makes these monthly readings a useful gauge of where Brazilian households and institutions are placing their cash.
For a foreign reader, the headline is less the size of the inflow than its destination. The money is not spreading evenly across the market; instead it is concentrating in one corner and draining steadily from another.
Fixed income does the heavy lifting
Almost the entire net inflow came from fixed-income funds, which gather money to lend to the government and to companies through bonds. Within that group, the strongest pull came from low-duration funds that hold government paper, a profile that prizes safety and quick access over higher but riskier returns.
The logic is straightforward. With the benchmark rate sitting high and the market betting it will stay there for longer, bonds offer generous, near-certain yields, and that is a hard combination for riskier products to compete with.
There were exceptions within the fixed-income camp. Funds free to hold riskier private credit still saw money leave, though at a slower pace than the month before, suggesting investors are favouring the safest end of the bond spectrum rather than reaching for yield.
Live Market IntelligenceBrazil — Live Market BoardInside: market breadth, the sector heatmap, currencies & rates, the Latin America scoreboard and the full instrument board.
Rio Times · Live Market Intelligence
Brazil — Live Market Board
B3 · São Paulo
Jun 9, 2026 · 05:11
Ibovespa · benchmark
168,669
-0.21%
+24.30% over 12 months
Market breadth · 15 names
40% advancing
6 ▲ advancing9 declining ▼
Currencies, rates & key inputs
USD / BRL
5.19
-0.13%
EUR / BRL
5.99
+0.41%
Selic rate
14.50%
·
Brent crude
92.97
-1.36%
Iron ore
161.91
·
Sector heatmap · average move today
Energy
+1.57%
PETR4, PRIO3
Industrials
+1.31%
WEGE3, RENT3
Materials
+0.55%
SUZB3
Utilities
+0.25%
ENEV3
Consumer Disc.
-0.18%
AZZA3
Mining
-0.54%
VALE3, CSNA3, GGBR4
Consumer Staples
-0.56%
ABEV3
Financials
-0.99%
ITUB4, BBDC4, BBAS3, B3SA3
Latin America scoreboard
IndexLastTodayStrength
IbovespaBrazil
168,669
-0.21%
S&P/BMV IPCMexico
65,650
-0.74%
S&P IPSAChile
10,164
-1.06%
S&P MERVALArgentina
3,112,024
+0.89%
MSCI COLCAPColombia
2,192.97
-1.58%
BVL S&P PerúPeru
34,937.73
+0.29%
Full instrument board
Instrument
Last
Change
YoY
Prev.
High
Low
Volume
IBOV
168,669
-0.21%
+24.30%
169,019
—
—
—
USD/BRL
5.19
-0.13%
-6.75%
5.19
5.19
5.18
—
SELIC
14.50%
—
—
—
—
—
PETR4
41.22
+0.81%
+41.31%
40.89
41.32
40.83
33,981,800
VALE3
78.07
-0.80%
+46.50%
78.70
79.28
77.32
15,662,100
ITUB4
38.52
-0.80%
+9.03%
38.83
39.08
38.43
23,088,400
BBDC4
17.20
-1.55%
+8.59%
17.47
17.51
17.18
18,097,500
BBAS3
19.10
-0.37%
-12.10%
19.17
19.34
19.10
15,270,400
B3SA3
15.22
-1.23%
+15.65%
15.41
15.40
15.07
42,509,900
ABEV3
16.08
-0.56%
+15.19%
16.17
16.23
15.95
18,018,600
WEGE3
44.00
+3.63%
+2.71%
42.46
44.36
42.32
9,645,500
PRIO3
62.54
+2.32%
+48.37%
61.12
62.62
61.38
5,961,800
SUZB3
41.97
+0.55%
-21.65%
41.74
42.16
41.41
4,564,400
RENT3
40.17
-1.01%
-7.99%
40.58
40.58
39.76
6,846,100
AZZA3
17.10
-0.18%
-59.48%
17.13
17.55
16.98
1,872,000
CSNA3
5.90
-1.67%
-28.92%
6.00
6.06
5.88
15,617,800
GGBR4
23.68
+0.85%
+33.33%
23.48
23.89
23.34
8,309,100
ENEV3
23.95
+0.25%
+75.07%
23.89
23.96
23.56
7,317,000
Largest moves today
WEGE3
44.00
+3.63%
PRIO3
62.54
+2.32%
CSNA3
5.90
-1.67%
BBDC4
17.20
-1.55%
B3SA3
15.22
-1.23%
RENT3
40.17
-1.01%
GGBR4
23.68
+0.85%
PETR4
41.22
+0.81%
The session read
The Ibovespa eased 0.21%, with breadth negative — 6 of 15 names higher. Energy led, while Financials lagged.
From The Rio Times
Related coverage · 9 Jun 2026
Chile’s Stock Market Drops Onto the Line That Has Held All Year
Read →
Shares keep losing ground
Equity funds went the other way, posting another month of net withdrawals that were modest in May but added to a steady drain over the year, as investors saw little reason to take stock-market risk when bonds were paying so well. Pension funds also lost money during the month, extending their own run of redemptions across 2026.
The pattern fits the wider mood on the local exchange, which has slid from its earlier highs amid an exodus of foreign investors and a tense external backdrop. When the safe option pays double digits, the case for owning shares has to be unusually strong to win the argument.
Not every riskier vehicle suffered. Index funds drew the second-largest inflow of the month, and structured vehicles such as receivables funds and private-equity funds continued to attract money over the year, a sign that some investors are still seeking returns beyond plain government debt.
Why the flows matter
Fund flows are a quiet but revealing signal. They show how millions of individual decisions add up, and right now they point in one direction, namely a preference for lending to the state over backing companies through their shares.
That tilt has consequences beyond the fund industry, because a market that channels savings into government bonds rather than equities gives companies a harder time raising capital and reinforces the high cost of money that sent investors toward fixed income in the first place. Until the rate outlook softens, the pattern is likely to persist, and the steady leak from equity funds suggests few investors expect that shift to arrive soon.
Frequently Asked Questions
What are net fund flows?
Net flows are deposits into investment funds minus withdrawals over a period. A positive figure means money came in on balance; a negative figure means investors pulled more out than they put in.
Why is fixed income attracting so much money?
Brazil’s benchmark interest rate is high and the market expects it to stay elevated. That makes bonds pay generous, relatively safe returns, which draws cash away from riskier products like stocks.
Why are equity funds losing money?
With bonds paying double-digit yields, investors see less reason to take stock-market risk. The local exchange has also slipped from its highs as foreign money has left, adding to the outflows.
Who publishes the data?
The figures come from Anbima, the body that represents Brazil’s financial and capital markets. It releases industry flow data each month, and the numbers are widely watched as a read on investor sentiment.
Connected Coverage
Brazil’s Selic Rate Explained: What Foreign Investors Need to Know
Fixed Income Dominates as Brazil’s Investments Hit a Milestone
View original source — Rio Times ↗
Related stories
Rio Times
BusinessJun 4, 2026 · 1 min
U.S. Share of Brazil Exports Falls as May Trade Surplus Beats Forecast
Rio Times
Bloomberg
BusinessJun 5, 2026 · 1 min
Goldman’s Flood Sees Buying Opportunity in Stock Market Selloff
Bloomberg
Bloomberg
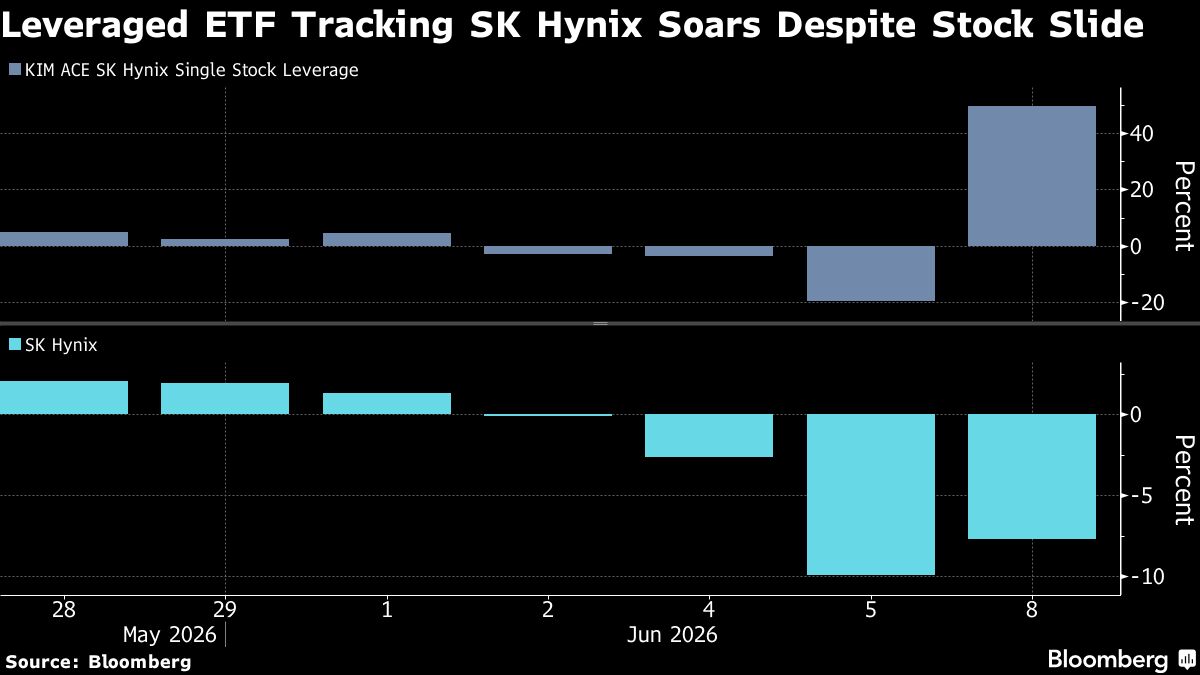
BusinessJun 8, 2026 · 1 min
Korean Leveraged ETF Misfires, Jumps 50% Even as SK Hynix Slumps
Bloomberg

Bloomberg
BusinessJun 19, 2026 · 1 min
US Stocks Draw Record Weekly Inflows as Investors Pile Into Tech
Bloomberg