
Hacker Noon
How we Reduced Engineering Software Cost by 18% While Scaling the Engineering Team by 47%
A practitioner case study in licensing discipline, utilisation analytics, legacy retirement and vendor negotiation Note: The examples and cases presented in this article are illustrative only and do not represent actual, disclosed engagements. They are intended solely to illustrate common patterns within the industry. | £30.5k → £25k Software cost per engineer / year | 85 → 125 Engineers supported (47% growth) | **18%**Net reduction in cost per head | |----|----|----| The Situation Between 2024 and 2025, the engineering organisation at a hydrogen-electric aviation startup grew from 85 to 125 engineers — a 47% increase driven by programme ramp-up across mechanical, electrical, software and systems disciplines. Growth at that pace usually drags tooling spend up in lockstep: more seats, more renewals, more shadow IT as teams self-provision point tools under delivery pressure. That is not what happened here. Engineering software cost per head fell from £30.5k to £25k per engineer per year — an 18% reduction — over the same period the team grew by almost half. This is the breakdown of how that was achieved, across four levers: licensing model redesign, utilisation analytics, legacy tool retirement and structured vendor negotiation. Why Cost Per Engineer, Not Total Spend In a scaling engineering organisation, total software spend is a misleading metric on its own — it will rise with headcount regardless of how well it is managed. The metric that matters is unit economics: cost per engineer per year. Tracking that number forces a different question in every renewal and procurement conversation: not “can we afford this licence,” but “what is this licence actually returning per engineer who touches it.” Framing tooling cost this way also made it possible to set a credible target with the executive team — reduce or hold cost per head while scaling — rather than an arbitrary spend-cut mandate that engineering would (rightly) resist. Lever 1: Licensing Model Redesign The starting position was a patchwork of named-user, floating and project-based licences accumulated organically as the company grew — typical of a fast-moving engineering organisation where each new programme procured what it needed without reference to what already existed elsewhere in the estate. • Consolidated overlapping CAD, simulation and PDM/PLM licences (including Teamcenter and associated NX seats) onto pooled, floating-licence models where usage patterns supported it, rather than per-named-user allocation. • Re-segmented licence tiers by actual role requirement — full design-authority seats for core CAD users, viewer or lightweight seats for reviewers and downstream consumers — instead of defaulting every engineer to the highest-cost tier. • Brought AI-assisted engineering and coding tools under a single governed model. Fragmented individual subscriptions to assistants such as GitHub Copilot and various point AI tools were consolidated into a hybrid enterprise arrangement, cutting run-rate from roughly £50k to £20k per year while closing data and IP governance gaps that the previous ad hoc model had created. Licensing redesign alone does not produce sustained savings unless it is paired with visibility into how licences are actually used — which is where utilisation analytics came in. Lever 2: Utilisation Analytics Before any tool was cut or re-tiered, usage had to be measured rather than assumed. Vendor entitlement reports, license-server logs and login/session data were pulled together to build a per-tool, per-seat utilisation picture across the engineering estate. • Identified seats with low or zero activity over rolling 90-day windows — the most common source of waste in fast-scaling organisations, where seats are provisioned ahead of need and rarely de-provisioned when need disappears. • Distinguished between tools with low utilisation that were nonetheless mission-critical (used rarely but by design — e.g. specialist analysis tools) from tools with low utilisation that were simply redundant or duplicative. • Used utilisation data as the evidence base for every subsequent decision — reclaiming and reallocating idle floating licences, right-sizing tier mix at renewal, and building the factual case for vendor negotiations rather than negotiating from list price alone. This analytics layer is what separates a one-off cost-cutting exercise from a repeatable governance practice: utilisation reporting became a standing input to the quarterly platform decision cadence, not a one-time audit. Lever 3: Legacy Tool Retirement Growth-stage engineering organisations accumulate tooling debt the same way they accumulate technical debt — each tool made sense in isolation when it was adopted, but the aggregate becomes expensive and hard to govern. Retiring legacy and overlapping tools was the third lever. • Identified functional overlap between legacy point tools and capability already present in the core PLM/MES/ERP platform stack, and retired the redundant tools rather than maintaining parallel licences for the same job. • Reset the Manufacturing Execution System (MES) approach from an external implementation-and-customisation programme to an in-house designed approach aligned to the broader integration strategy — reducing annualised MES cost from roughly £450k to £250k while also cutting vendor lock-in and delivery risk. • Where legacy systems held years of historical engineering data (for example, long-lived document archives), retirement was sequenced around proper data migration and traceability — not a simple cancellation — so that compliance and audit requirements in a regulated engineering environment were preserved throughout. Each retirement decision went through the same governance gate as new procurement: an owner, a funding decision and a documented rationale, reviewed in the quarterly platform cadence covering PLM, ALM, ERP and MES. Lever 4: Vendor Negotiation The fourth lever converted the evidence generated by the first three — redesigned licensing tiers, utilisation data and a shorter tool list — into renegotiated commercial terms. • Entered renewal conversations with utilisation data in hand, replacing list-price renewal with evidence-based negotiation on actual seat counts and usage tiers rather than historical contract values. • Used the threat and reality of consolidation — fewer overlapping tools, fewer vendors — as negotiating leverage, since vendors had clear visibility that redundant products were being actively removed from the estate. • Applied portfolio-level vendor management across roughly 120 active contracts, treating renewals as a continuous discipline rather than a once-a-year scramble, with renewal timing, owner accountability and value modelling tracked centrally. None of this depended on adversarial tactics. It depended on showing up to each renewal with better information than the vendor expected — actual usage, a clear view of overlap with other tools in the estate, and a documented willingness to walk away from underused capability. Why This Matters Beyond the Numbers The headline result — 18% lower cost per engineer while scaling the team by 47% — is the output. The more durable outcome is that licensing discipline, utilisation analytics, legacy retirement and vendor negotiation became standing practices rather than a one-off cost initiative. In a regulated, safety-critical engineering environment, that governance rigour also pays a second dividend: a cleaner, better-documented tooling estate is easier to defend in an audit and easier to extend as the next phase of scaling begins. For other engineering leaders facing similar growth, the transferable principle is simple: track cost per engineer, not total spend; measure utilisation before you cut anything; treat retirement and renewal as governed decisions, not annual chores; and let usage data — not vendor list prices — set the terms of every negotiation. \
View original source — Hacker Noon ↗
Related stories

TechRadar
TechnologyJun 25, 2026 · 1 min
Don't be tempted by the lowest-ever Nintendo Switch Prime Day discount, I'm a gaming editor and the Switch 2 is still…
TechRadar

TechRadar
TechnologyJun 25, 2026 · 1 min
Currys is a goldmine for back-to-school and business laptop deals from Asus, HP, and Lenovo
TechRadar

Lovin Malta
TechnologyJun 25, 2026 · 1 min
European Commission Releases First €3.2 Billion Under €90 Billion Ukraine Loan
Lovin Malta
Engadget
TechnologyJun 25, 2026 · 1 min
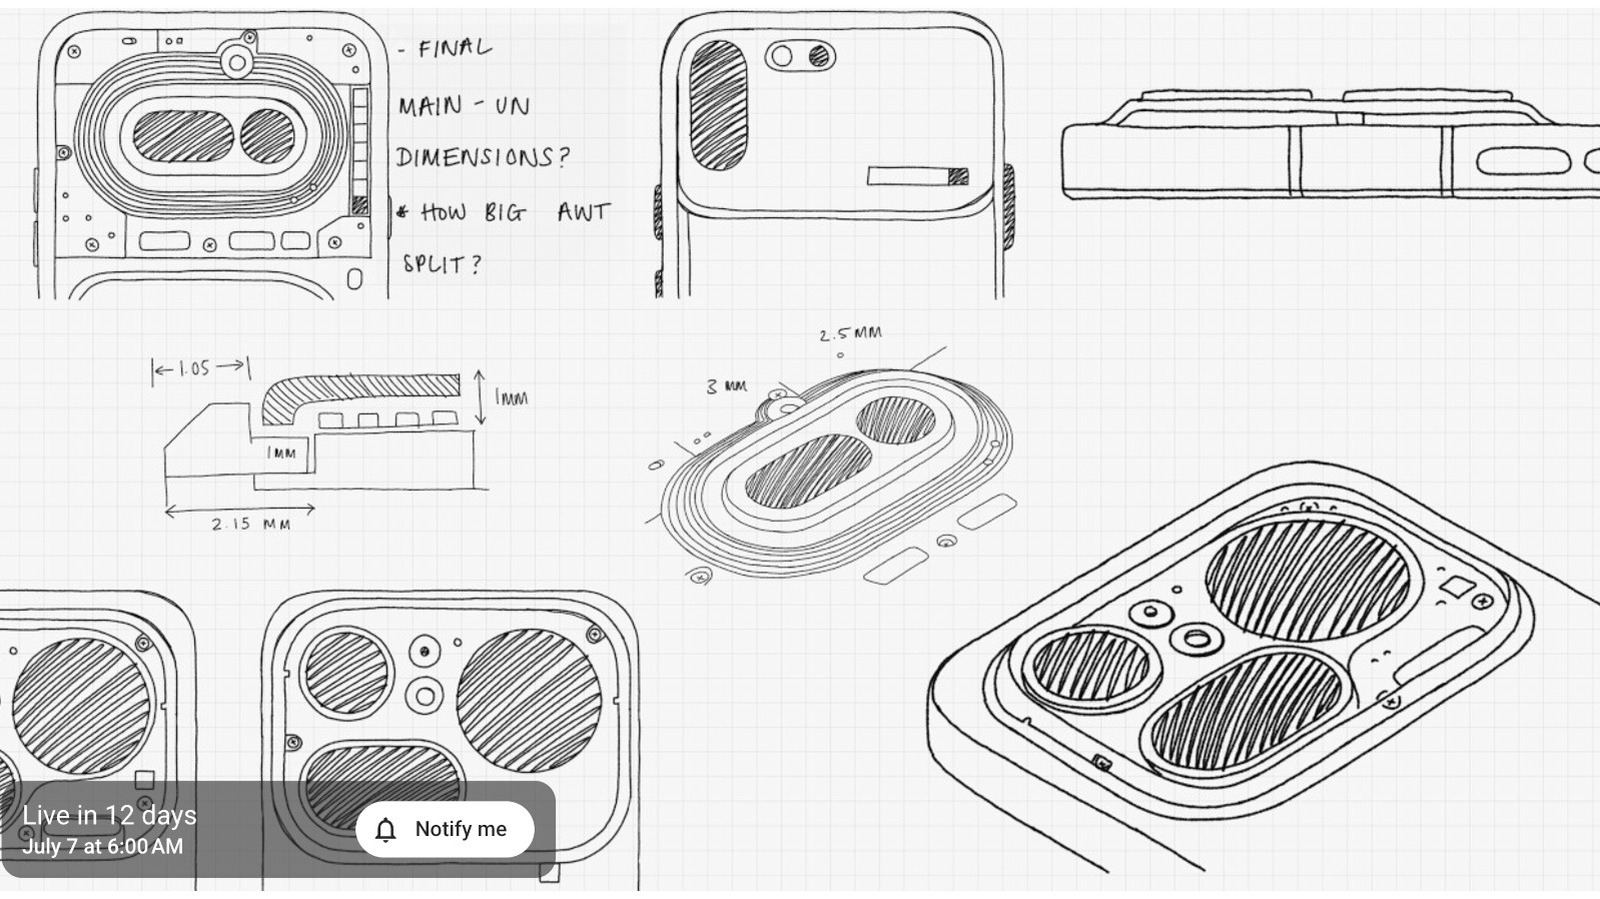
Nothing teases the Phone 4b, launching on July 7
Engadget