TechRadar
I used this free tool to see every road collision near my home over the past 25 years
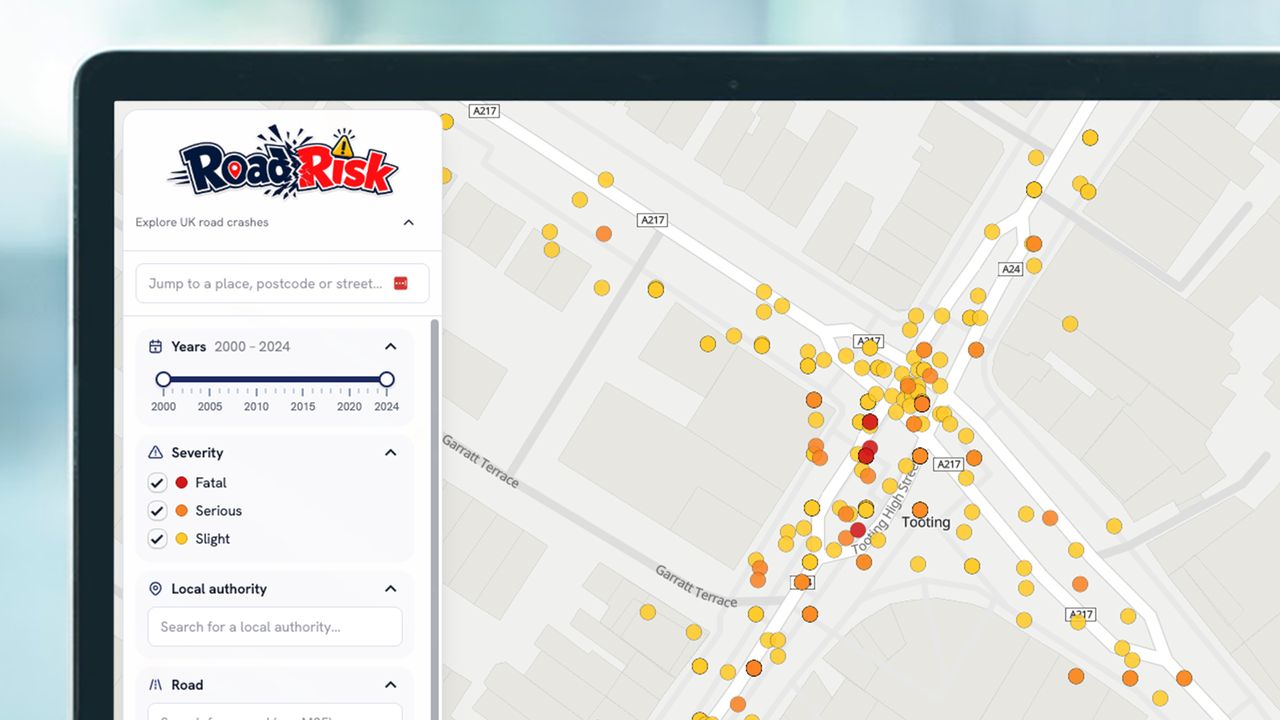
Website maps open source accident data onto an interactive map
Users can see the most dangerous roads around them
Collisions are graded in severity
Cyclists, pedestrians and careful drivers could find the data offered by interactive online mapping service RoadRisk invaluable when attempting to plan the safest routes for getting from A to B.
The online tool, which uses OpenStreetMap at its core and STATS19 accident reports from police forces in England, Scotland or Wales, handily plots all collision data from the year 2000 to 2025 onto an easy-to-navigate map.
Simply punch in a post code and the website will reveal all accident data from some 350 local authorities over the past 25 years, colour-coding each based on the severity of the collision: slight, serious and fatal.
Not only can you see the most dangerous routes in your area, or in a proposed location, you can also delve into the data to see date, time, location, road and junction details, weather and surface conditions, as well as full records for each vehicle and casualty involved.
The STATS19 data does not contain names, addresses, phone numbers or vehicle registration details, with only age, sex and an area-level deprivation score given.
Interestingly, the site’s homepage also lists the worst roads for fatal crashes (that will be the A38) and the worst local authorities for collisions, which is Birmingham.
RoadRisk says the UK’s Department for Transport typically publishes each year's accident data around September of the following year, with the maps updated shortly after each release.
Sign up for breaking news, reviews, opinion, top tech deals, and more.
Analysis: A handy tool for parents and cyclists
RoadRisk is an interesting proposition and, while you can’t plan a route using the software and navigate via the ‘safest’ roads, it is a great tool for scoping out accident hotpsots in the local area.
As a parent with children old enough to walk to school alone, it was interesting to explore the roads near me with the highest accident rates. More interestingly, many of those involved individuals aged between 11 and 15.
Those shocking results backed up my decision to walk them across some of the most perilous routes before waving them off in the mornings.
Similarly, there are a number of roads in my local area that appear to be hotspots for collisions involving cyclists, which could well inform the next route I take into town.
What’s more, RoadRisk says anyone can use the data to quote statistics, take screenshots, and use the information for any purpose — a boon for anyone lobbying the local authority for safer roads.
Follow TechRadar on Google News and add us as a preferred source to get our expert news, reviews, and opinion in your feeds.
Leon has been navigating a world where automotive and tech collide for almost 20 years, reporting on everything from in-car entertainment to robotised manufacturing plants. Currently, EVs are the focus of his attentions, but give it a few years and it will be electric vertical take-off and landing craft. Outside of work hours, he can be found tinkering with distinctly analogue motorcycles, because electric motors are no replacement for an old Honda inline four.
View original source — TechRadar ↗
Related stories

Dawn
TechnologyJul 7, 2026 · 1 min
Three ships struck in Hormuz flare-up, Qatar slams Iranian attack
Dawn

ZDNet
TechnologyJul 7, 2026 · 1 min
You can soon restore Windows 11 from scratch even if it can't boot up - here's how
ZDNet

Engadget
TechnologyJul 7, 2026 · 1 min
Google's next Pixel event is on August 12
Engadget

TechRadar
TechnologyJul 7, 2026 · 1 min
Asus ProArt PA32KCX review: Over $8K for a 32-inch 8K monitor and a whole lot of dimming zones
TechRadar